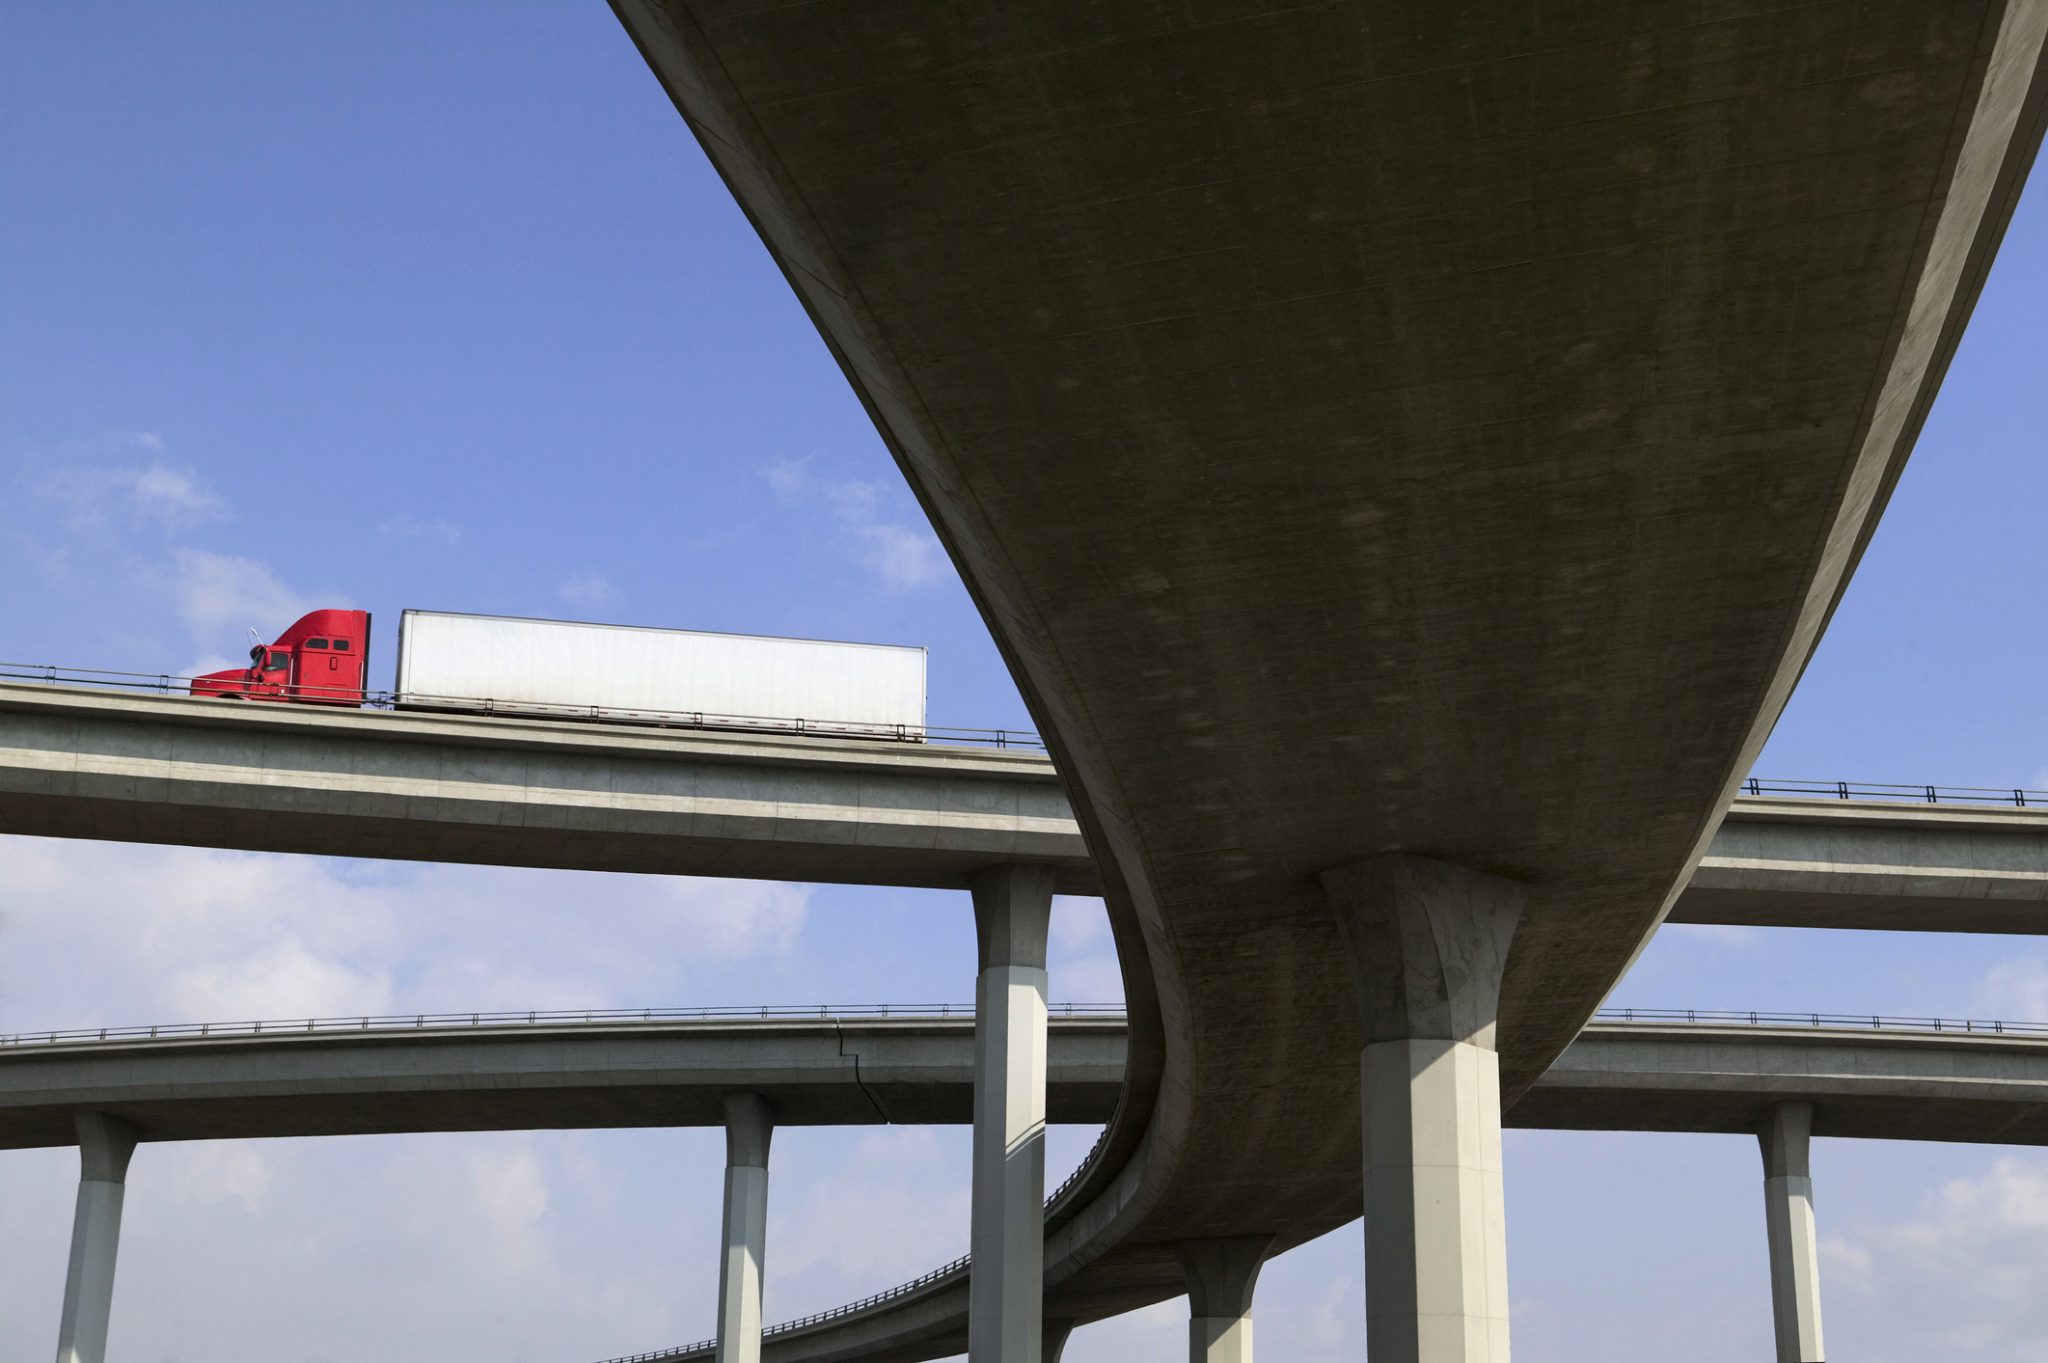
Instead of a bridge over troubled waters, the US is plagued by water running under troubled bridges.
In today’s polarized environment, it is rare to find something that just about everyone can agree upon. The one topic that creates bipartisan ire is the sad, sad state of our national infrastructure. For those of us responsible for using the nation’s highways and bridges to get our shipments to market, it is especially disheartening.
Over the past years, a number of NationaLease blogs have addressed this issue and the lack of response to get the job done, not in a patchwork style but in a more permanent fashion. Just last week, the issue came up again in a Truckinginfo.com article,”1,100 Miles of Bridges in Desperate Need of Repair.”
If that number doesn’t seem alarming in and of itself (although it actually measures the distance between Chicago and Houston), consider that the actual number of bridges that are rated structurally deficient and in need of repair exceeds 47,000! That’s out of a total of 616,087 bridges throughout the U.S. The average age for these troubled bridges is 62 years; if they were human, they could qualify for early Social Security. I am not trying to make light of the situation. It is incredibly upsetting when you consider that cars, trucks, and buses cross these problematic bridges 178 million times every day.
The American Society of Civil Engineers (ASCE) issues an Infrastructure Report Card every four years. The last report card, issued in 2017, gave the US infrastructure a D+ grade, barely above failure. The ASCE estimates it would cost $4.5 trillion to repair all parts of the infrastructure by 2025. The American Road & Transportation Builders Association has ranked 235,000 bridges (a number which includes the 47,000 that are the worst) as needing some structural repair, rehabilitation. Estimates to accomplish this approach $171 billion.
Yet instead of speeding up the repair process, it seems to be slowing down. Looking at the current rate of repair, it will take over 80 years to make all the significant repairs on the worst bridges. If you cross one of these bridges daily, you know how bad the situation really is. You face not only the dangers of a bridge collapse (which thankfully is an extremely rare occurrence) but more likely congestion and long delays due to emergency repairs. So which bridges are the worst? According to the article (which is based on the American Road & Transportation Builders Association report), the list of structurally deficient bridges includes:
- New York’s Brooklyn Bridge
- Memorial Bridge connecting Washington, D.C. at the Lincoln Memorial with Arlington, VA
- San Mateo-Hayward Bridge crossing California’s San Francisco Bay – the longest bridge in California
- Robert S. Maestri Bridge over Lake Pontchartrain in Louisiana
- Albemarle Sound Bridge and the Lindsay C. Warren Bridge crossing the Alligator River in NC
- Florida’s Pensacola Bay Bridge
- Vicksburg Bridge in MS
- Lacey V. Murrow Memorial Bridge in Washington state
- In addition, the most traveled structurally deficient bridges are on parts of Route 101, Interstate 405 and Interstate 5 in California, where daily crossings are as high as 289,000 per day.
In 2007, the I-35W ridge collapsed in Minneapolis, killing 13 people; before that, the I-40 bridge in Oklahoma collapsed, killing 14. Hopefully, action will take place before the next disaster. Maybe this is an issue that can “bridge the gap” between all people. We can only hope.


